1. Shift from rules to personal economics
Replace one-size-fits-all guidance with decisions grounded in your own lifetime resources, risks, and goals, so institutions stop setting the agenda for you.
You know the basics. Now make them work together.
You already make financial decisions. Path 2 helps you turn them into a plan that actually fits your life — one framework for spending, saving, borrowing, and protecting what you’ve built.
You might be here because your quiz score placed you directly into Path 2, or because you’ve just finished Path 1 and are ready for the next step. Either way, this path assumes you know the basics and focuses on turning that knowledge into a plan that holds up.
By the end, you’ll see your finances through a full life-cycle lens instead of disconnected rules of thumb.
Replace one-size-fits-all guidance with decisions grounded in your own lifetime resources, risks, and goals, so institutions stop setting the agenda for you.
Combine conventional net worth with human capital and promised income streams to see your full “economic wealth,” not just what sits in today’s accounts.
Learn to translate your lifetime resources into a sustainable annual living standard, and see why borrowing when young and saving when older can both be logical.
Start from a target living standard and let saving, borrowing, and debt repayment fall out of that plan, instead of chasing arbitrary “save X%” rules.
Use diminishing marginal utility and the life-cycle model to understand why smoothing your consumption over time usually delivers more lifetime well-being than feast-and-famine patterns.
Five focused lessons. Each builds on the life-cycle framework you started in Path 1.
Conventional household finance is driven by rules from institutions rather than your personal economics. It is time for you to get the control!
Distinguish between financial wealth (assets less liabilities) and economic wealth (financial wealth plus human capital), and see why your “true” balance sheet is much larger than what your brokerage statement shows.
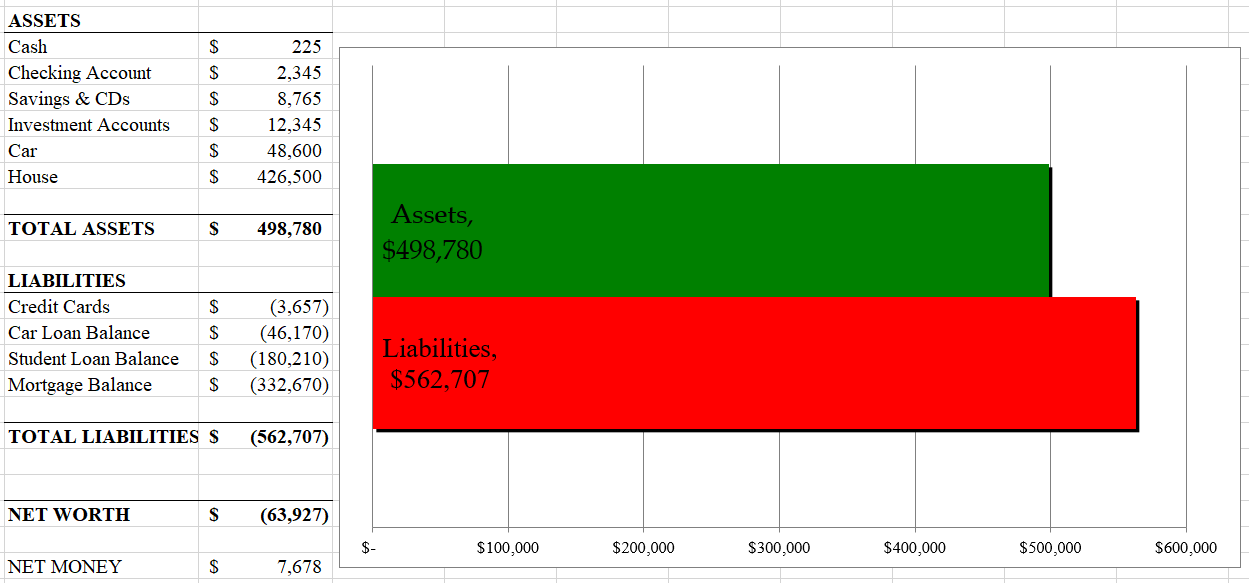
To see why this matters, imagine two neighbors, Dr. West and Mr. East. Both are 40, married with two young children, and live across the street from each other in similar homes. Dr. West is a physician earning $160,000 per year and driving a new Tesla. Mr. East owns a small engine repair business, earns $85,000 per year, and drives a 3-year-old pickup. From the sidewalk, most people would guess that Dr. West is in much better financial shape than Mr. East.
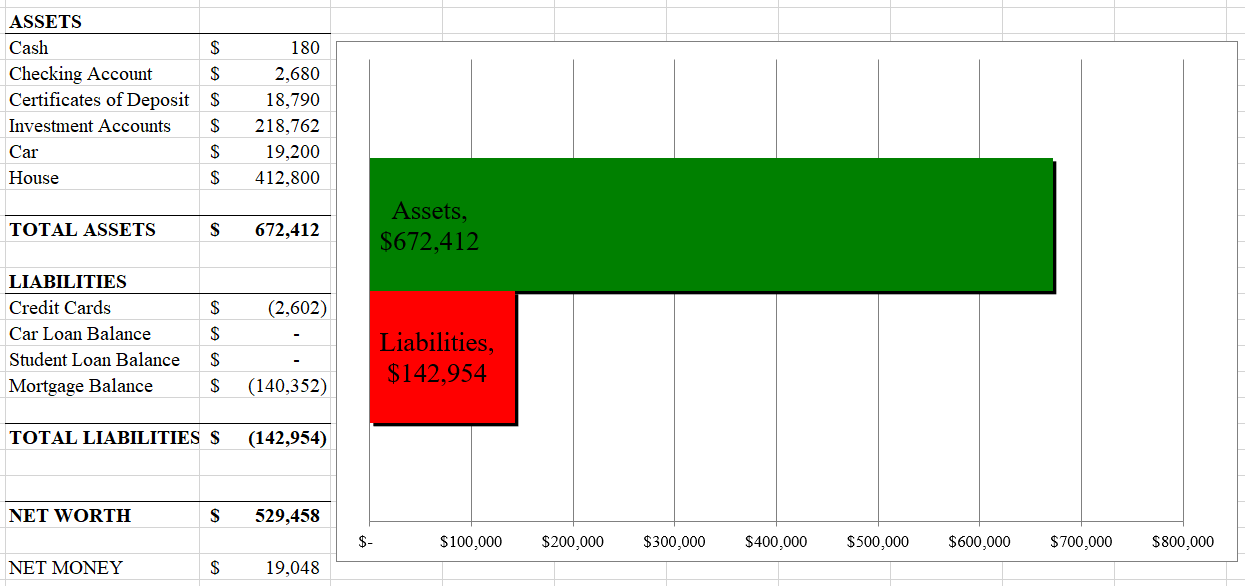
Their conventional balance sheets tell a very different story. Dr. West has about $499,000 in assets and $563,000 in liabilities, for a conventional net worth of roughly –$64,000. Mr. East has about $672,000 in assets and $143,000 in liabilities, for a conventional net worth of about $529,000. On paper, at age 40, Mr. East is ahead by almost $600,000 in conventional net worth.
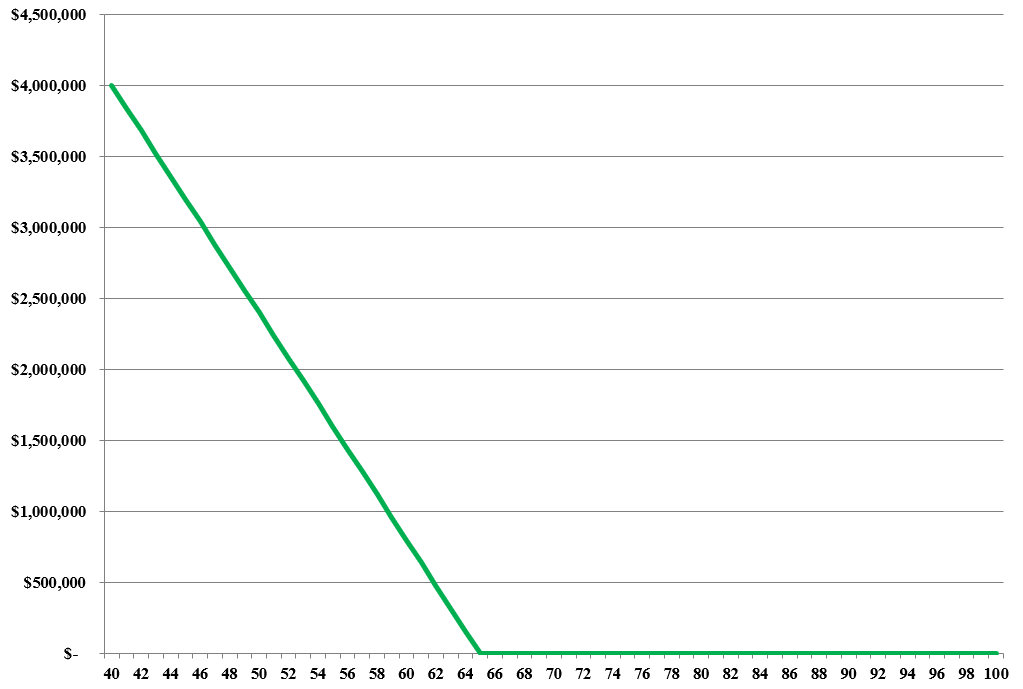
But conventional net worth only summarizes the past: the assets and debts accumulated so far. It ignores the most important asset for a 40-year-old household – the ability to earn income in the future. When we add human capital (the present value of future labor income), the picture shifts. Dr. West’s human capital is on the order of $4,000,000, while Mr. East’s is about $2,125,000.
You can make a rough estimate of your own future income by taking your annual income this year (before taxes) and multiplying it by the number of years you expect to work until retirement. More precise estimates of human capital adjust for taxes, expected raises, inflation, and risk, but you do not need that level of detail yet — this simple approximation is good enough to see how large your future labor income is relative to today’s account balances.
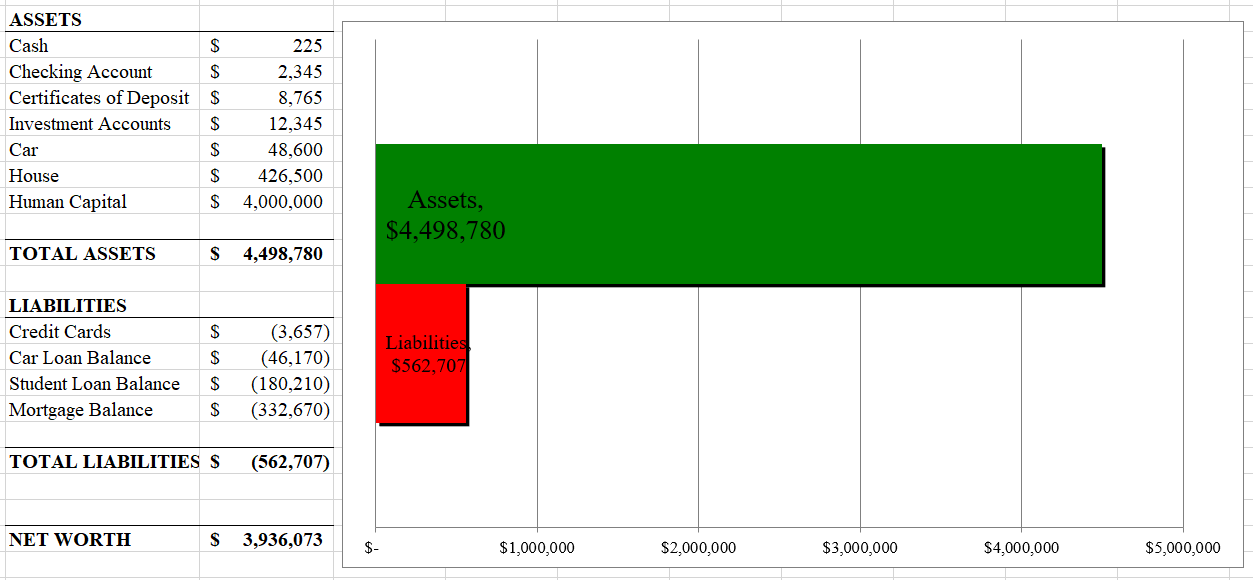
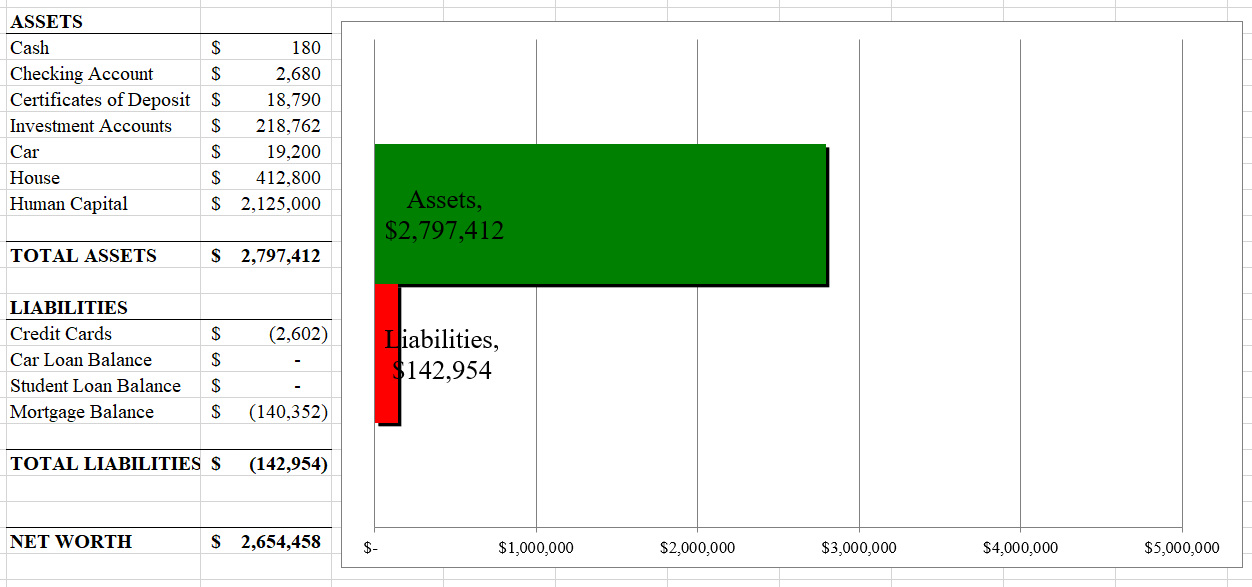
Economic net worth combines conventional net worth with human capital and other income-producing promises like pensions, annuities, and Social Security. On this broader balance sheet, Dr. West’s total resources are much larger than Mr. East’s, even though her conventional net worth is currently negative.
The key takeaway is that you cannot judge financial fitness from outside appearances or from conventional net worth alone. A complete picture of your “lifetime balance sheet” must include both what you own today and the income your skills, pensions, and Social Security will generate in the future.
You have now seen how Dr. West and Mr. East look very different once we include human capital and promised income streams. Before moving on, take a few minutes to sketch a first draft of your own lifetime balance sheet.
Now step back and write one sentence answering this question:
“Compared with the net worth I usually think about, my lifetime balance sheet is __________.”
Write this number down and keep it somewhere accessible. You now have an intuitive feel for how much you are truly worth — and it is almost certainly much larger than your brokerage statement suggests. Human capital matters most when you are young; it is the primary reason to carry life insurance. By retirement, human capital has fallen to zero. A retiree's wealth lives entirely in savings, retirement accounts, Social Security benefits, and owned property.
Explore the idea of a stable living standard across your life, and how borrowing when young and saving when older can be logical, not reckless or overly cautious.
Every household is quietly asking the same question: “What can we really afford to spend each year?” The details differ for a middle-of-life couple in Brooklyn, a retiree in Brownsville, or a new grad heading to a FinTech job in Santa Clara, but the core affordability problem is the same.
A simple way to start is to notice that at any point in time you have a current age and a finite, though uncertain, remaining lifetime. If we conservatively assume you need resources up to age 100, you can take today’s value of your available resources and divide by your expected remaining years to get a rough annual affordability number.
This rough calculation is limited, but it helps you see the difference between someone with a very high stock of resources and someone with much less. The life-cycle model turns this kind of thinking into a systematic way to plan your lifetime living standard.
Economists use a utility function to describe happiness from consumption. Total utility rises as consumption rises, but at a diminishing rate. This is the law of diminishing marginal utility.
The life-cycle model applies diminishing marginal utility to lifetime consumption. Rather than living very well in some years and scraping by in others, it is usually better to smooth your living standard so the marginal value of a dollar is similar across years.
The logic is symmetric: spending far too much today starves your future self, while spending far too little today makes no sense if you know you will have more resources tomorrow. Stability, not sacrifice, is the goal.
See savings as the result of a forward-looking spending plan rather than an independent target, and understand how this differs from conventional “save X%” guidance.
Lesson 3 gave you the intuition — stable living standards, diminishing marginal utility, and the logic of consumption smoothing. This lesson goes one layer deeper and traces where those ideas come from, so you understand not just what the life-cycle model says but why it is the right framework for personal financial decisions.
Economics-based financial planning begins with a simple but powerful idea: households should make financial decisions in ways that maximize lifetime well-being, not simply current income, current wealth, or arbitrary savings targets. In this approach, the central objective is to maintain the highest feasible living standard over time, given all of a household’s expected lifetime resources, obligations, risks, and constraints.
The intellectual roots of this framework go back to Irving Fisher, whose work on intertemporal choice showed that consumption, saving, borrowing, and investing are all parts of one unified problem. Because of diminishing marginal utility, people generally do not want to splurge when income is high and suffer when income is low; instead, they prefer to spread resources across time so that their standard of living is smoother and more stable. This idea is known as consumption smoothing and it remains the core principle of economics-based planning.
In the 1950s, Franco Modigliani, Richard Brumberg, Milton Friedman, Paul Samuelson, and others extended Fisher’s framework into what became known as the life-cycle model of saving. The life-cycle model recognizes that earnings, family size, taxes, and spending needs change predictably over time, so the relevant planning problem is not “How much should I save this year?” but rather “What pattern of spending, saving, borrowing, insurance, and investing best supports my lifetime living standard?”
See savings as the result of a forward-looking spending plan rather than an independent target, and understand how this differs from conventional “save X%” guidance.
One of the most important lessons of economics-based planning is that saving is not a moral rule or an end in itself. Saving and borrowing are outcomes of a deeper optimization problem: if current income is high relative to a household’s sustainable living standard, the household should save; if current income is temporarily low, borrowing or asset drawdown may be entirely rational. The goal is not to maximize account balances, but to allocate resources across life in a way that supports the household’s well-being as efficiently as possible.
The same logic applies to insurance and investing. Insurance is not mainly about accumulating large payouts, but about protecting living standards in bad states of the world. Portfolio choice is not just about maximizing expected return or minimizing volatility in isolation; it is about understanding how investment outcomes affect the household’s future spending power and standard of living. Economics-based planning therefore unifies spending, saving, insurance, Social Security claiming, tax strategy, and investing into one integrated framework.
With economic happiness grounded in utility theory, the life-cycle model answers a central question: how should households choose how much to consume each year, given all the different ways they could spread resources over their lives?
In theory, Harrison Connor could choose hundreds of different “young/old” consumption pairs that still sum to his $10 million inheritance. The question is not which pattern looks most exciting, but which pattern produces the highest total utility.
The logic rests on diminishing marginal utility. When you are close to “starving,” each additional dollar of consumption delivers very high marginal utility; when you are “gorging,” each extra dollar adds relatively little.
Consumption smoothing identifies the standard of living that creates the highest level of economic happiness in utility terms. Saving and borrowing show up as the tools that support this smoothed path, not as rules you obey off the top.
Real households face taxes, Social Security rules, retirement accounts, borrowing constraints, changing family composition, uncertain longevity, and many other interacting variables. That complexity is why economists rely on dynamic programming and other tools to solve life-cycle problems: the right decision today depends on all the decisions and constraints that follow tomorrow. For many years, this made the economics approach more of an academic framework than a practical planning method.
Today, modern software can implement these ideas directly. Tools like MaxiFi Planner estimate lifetime resources, account for taxes and government benefits, model borrowing constraints and demographic changes, and compute a sustainable living standard in seconds. Instead of starting from arbitrary rules such as “save 15%” or “aim for an 80% replacement rate,” the analysis begins with the economics question itself: what is the highest sustainable living standard this household can afford, and what set of financial choices best supports it?
Next step: Answer ten questions drawn from the Path 2 question bank to see if you’re ready to move on. Do well on the quiz and you’ll unlock a short 1:1 Zoom conversation with me, focused entirely on your questions and how to apply these ideas to your own situation — just help thinking more clearly about your money and a thanks for using Moneygimme.
Answer ten questions drawn from the Path 2 question bank to see if you’re ready to move on.
Path 2 gives you the economics. MaxiFi can turn your data into a detailed lifetime plan that quantifies tradeoffs you’ve just learned about.
Explore MaxiFi Planner